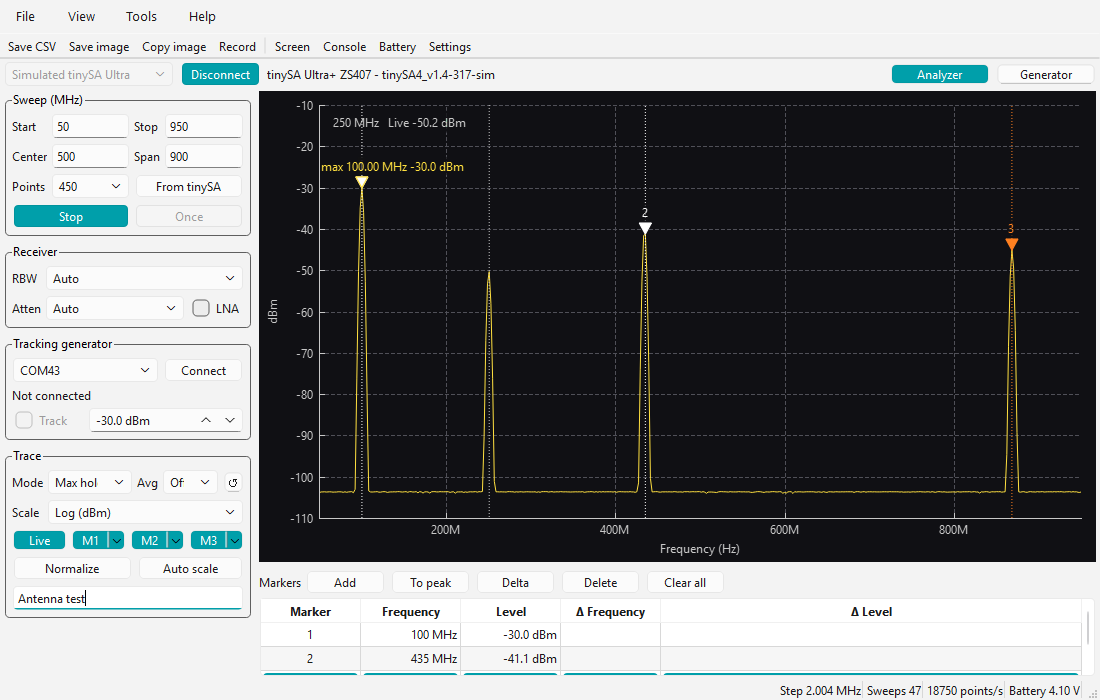
tinySA-App is a free Windows program that controls a tinySA, tinySA Ultra or tinySA Ultra+ over USB. With it you can:
- use the tinySA as a spectrum analyzer with a large graph, markers, trace memories and CSV export
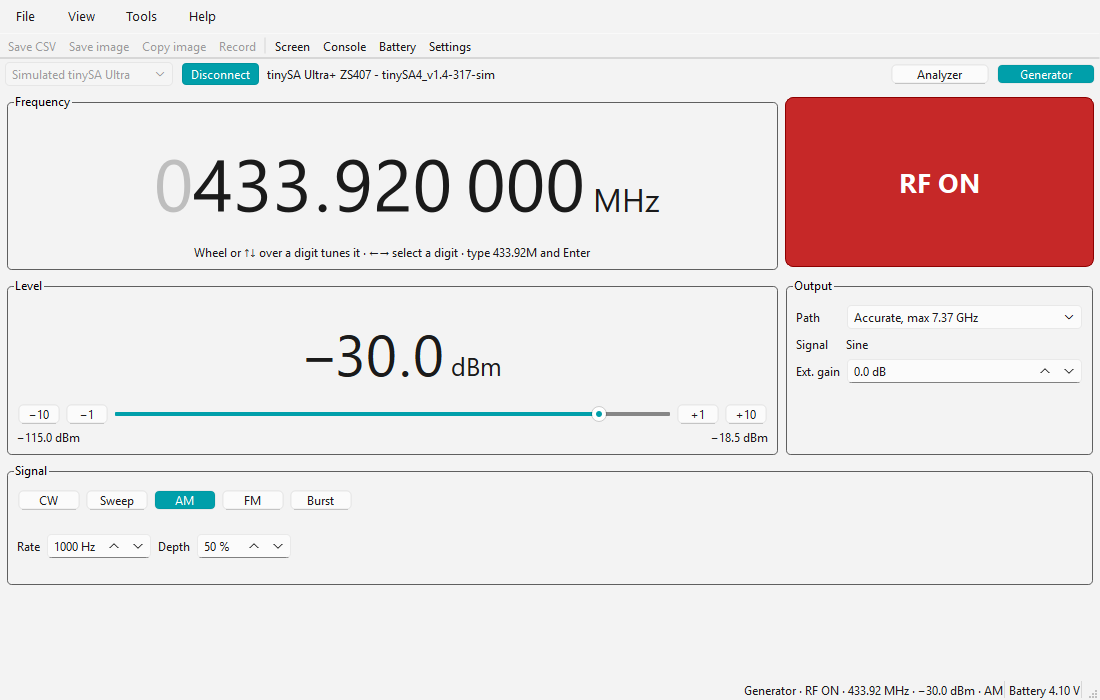
- use the tinySA as a signal generator
- use a second tinySA as a tracking generator, to measure the frequency response of filters, amplifiers and cables
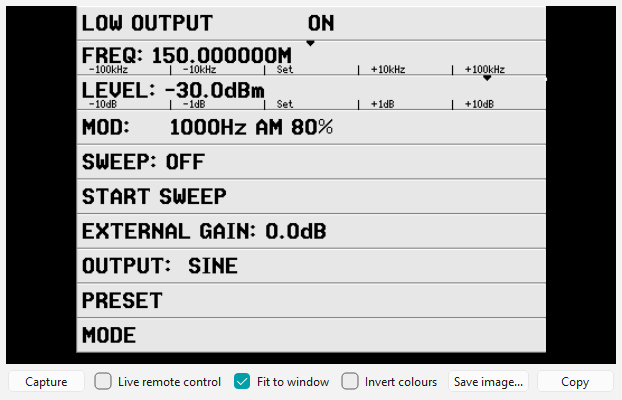
- see the tinySA's screen and control it with the mouse
- update the firmware
The app reads the model from the tinySA when it connects, so it only shows the controls that model has.
Installing and starting
tinySA-App runs on 64-bit Windows 10 and 11.
- Download the zip file from http://dfu.tinydevices.org/tinySA/Windows/.
- Unzip it into a folder of your choice and start tinySA-App.exe. Nothing needs to be installed, and the tinySA needs no driver for normal use.
- Your anti-virus software may warn about the program the first few times you run it. You can click the warning away.
- changelog.txt in the zip lists what changed in each version. Help > About shows the version you have.
The app keeps its settings in tinySA-App.settings.ini next to the exe. If it cannot write to that folder, it uses %APPDATA%\tinySA-App instead. The three trace memories are kept next to the settings file as tinySA-App.M1.csv to M3.csv. Delete the settings file to start again with the default settings.
Firmware: use tinySA firmware v1.4-266 or newer. Older firmware can lose a command sent over USB and then stop answering until the tinySA is restarted. With such firmware the app shows "Old firmware: may stop answering over USB" next to the device name, with a link to the firmware update. Some features need newer firmware, as noted where they are described below. See Updating the firmware.
Connecting
Connect the tinySA with a USB cable and switch it on. The bar at the top of the window has:
- Port: the serial port of the tinySA. A connected tinySA is selected automatically.
- Connect / Disconnect
- The model and firmware version of the connected tinySA
- Analyzer | Generator: switches the tinySA between spectrum analyzer and signal generator. If the tinySA is already generating when the app connects, the app opens the generator page.
A terminal program or another app that has the port open stops tinySA-App from connecting: close that program first. If no port appears when you plug in the tinySA, see the Device Manager tip on the PC control page.
The status bar at the bottom shows:
- the frequency step between two points
- the number of sweeps
- the measurement speed in points per second
- the battery voltage, read every 6 seconds
- while averaging, "Avg n/N": how many sweeps are in the average so far
Spectrum analyzer
The app measures with the tinySA's own frequency grid, so a signal exactly on a point's frequency is measured on that point. Settings you change while scanning apply from the next sweep.
Sweep
- Start, Stop, Center and Span in MHz. Type a value and press Enter.
- Points: 51 to 30000 points per sweep. More points take longer.
- From tinySA: sweeps the range that was set on the tinySA itself.
- Scan sweeps continuously and Once sweeps once. Press Stop or Esc to stop.
The app limits the range to what the model can measure. For example, the LOW input of the tinySA basic goes up to 350 MHz.
With tinySA Ultra firmware v1.4-314 or newer, the tinySA's screen is switched off while the app scans, and the tinySA shows "Remote only mode". The tinySA then does not spend time redrawing its screen. Touching the tinySA's screen or the jog switch gives the screen back and stops the scan. You can switch this off with Tools > Settings > Device > "Turn the tinySA screen off while scanning".
Receiver
- RBW: Auto, or one of the resolution bandwidths of the model. See RBW.
- Atten: Auto, or the input attenuation in dB. See Attenuation.
- LNA (tinySA Ultra): the low noise amplifier.
- Input (tinySA basic): LOW input (0 to 350 MHz) or HIGH input (240 to 960 MHz).
Trace
- Mode: Normal, Max hold or Min hold.
- Avg: moving average of the power over 2 to 64 sweeps. The ↺ button next to it starts the averaging and the max/min hold again.
- Scale: log (dBm) or linear (W).
- Live: shows or hides the live trace.
- M1, M2, M3: three trace memories. Click a memory to show or hide it. The arrow next to it opens a menu with Store live trace, Load CSV, Save CSV and Clear. The memories are kept when you close the app.
- Normalize: shows the levels relative to the trace at the moment you switch it on, in dB. This is mostly used with a tracking generator.
- Auto scale: fits the graph's level range to the trace once.
- Sweep name: a text that is shown above saved images and in saved CSV files.
Using the graph
| Action | Result |
|---|
| Move the mouse over the graph | Shows the frequency at the mouse and the level of the trace there |
| Drag the frequency scale | The left third moves the start, the right third moves the stop, the middle shifts the whole range. The new range is swept when you let go |
| Drag the level scale | The top third moves the top, the bottom third moves the bottom, the middle shifts the levels |
| Mouse wheel over the graph or the frequency scale | Zooms the span in or out around the mouse |
| Mouse wheel over the level scale | Zooms the level range |
| PgUp / PgDn | Zooms in / out around the center |
| Esc | Stops scanning |
| Right click | Menu: markers, Start / Center / Stop here, auto scale, set top or bottom level, spline, show points, save or copy image |
Markers
- Double click on the graph to add a marker, double click on a marker to delete it.
- Click a marker to select it, then drag it, or move it one point with the Left and Right arrow keys. Del deletes the selected marker. Dropping a marker outside the graph also deletes it.
- The buttons under the graph: Add (a marker at the strongest signal), To peak (moves the selected marker to the strongest signal), Delta, Delete and Clear all.
- A delta marker shows its frequency and level relative to the first normal marker.
- The marker list under the graph shows the frequency and level of every marker and, for delta markers, the differences. View > Marker list shows or hides it.
- Right click > Show max marker / Show min marker adds a marker that follows the strongest or weakest signal. Its frequency is interpolated between the points, so it is more precise than the frequency step.
- The markers are kept when you close the app.
Saving traces and images
- File > Save CSV (Ctrl+S) saves the live trace with one line per point: frequency in Hz and level in dBm.
- File > Record saves every sweep as a CSV file, in a new folder (named after the date and time) in the record folder. Click Record again to stop.
- File > Save image saves the graph as a PNG, JPEG or bitmap file, with the sweep name and the date above it. Copy image (Ctrl+C) copies it to the clipboard.
- Tools > Settings > Files sets the folder for these files, the CSV field separator (semicolon, comma or tab) and a decimal comma. "MHz CSV for wireless managers" writes the CSV format of the tinySA's own MHz CSV files, lines like 433.920000,-85.25 without header lines, which Wireless Workbench and other wireless managers can read.
Signal generator
Click Generator in the top bar to turn the tinySA into a signal generator. A generator page replaces the controls and the graph, like the generator screen of the tinySA itself. The RF output is always off when you switch to the generator. Click Analyzer to go back.
- Frequency and Level are shown in large digits. Turn the mouse wheel or press Up/Down over a digit to change that digit. Left/Right select another digit. You can also type a value, for example 433.92M or -30, and press Enter.
- The level also has -10, -1, +1 and +10 dB buttons, and a slider between the lowest and the highest level of the output.
- RF ON / RF OFF switches the output on or off. Esc switches it off.
Output
- Path: on the tinySA basic the LOW or HIGH output connector. On the tinySA Ultra "Accurate" (highest level accuracy, through the mixer) or "Cleanest" (cleanest signal, directly from the synthesizer), each with the highest frequency of that path, as in the OUTPUT menu of the tinySA.
- Signal: what the tinySA generates at the set frequency (sine, square wave or mixer), as its OUTPUT menu shows it.
- Ext. gain: the gain of an amplifier (positive) or attenuator (negative) after the tinySA. The levels are then shown and entered as the level at the device under test.
Signal
- CW: unmodulated carrier.
- Sweep: sweeps the frequency between Start and Stop, or over a Span around the frequency. Time sets the duration of one sweep (0 = as fast as possible). Level change changes the level over the sweep (LOW output).
- AM: rate and depth.
- FM (tinySA Ultra): rate and deviation.
- NFM, WFM and Ext (tinySA basic): narrow FM, wide FM and external modulation.
- Burst (tinySA Ultra firmware v1.4-305 or newer): the output is on for the On time of every Period. Period and On time are in seconds and take units, for example 100u, 1.5m or 2. With Count 0 the bursts repeat continuously. With a Count of 1 to 65535 the tinySA sends that many bursts after each click on Start burst. Above 1.13 GHz burst needs Path Accurate. See Modulation.
Sweep and modulation are never on at the same time.
A tinySA that is already generating
When the app connects to a tinySA that is generating, it opens the generator page with the frequency, span, external gain and sweep time of the tinySA. The RF output, the level and the modulation cannot be read from the tinySA: they show "?" and are not changed until you set them. When the app closes or disconnects, the tinySA keeps generating. The app keeps the generator settings between runs, except RF, which always starts off.
Tracking generator
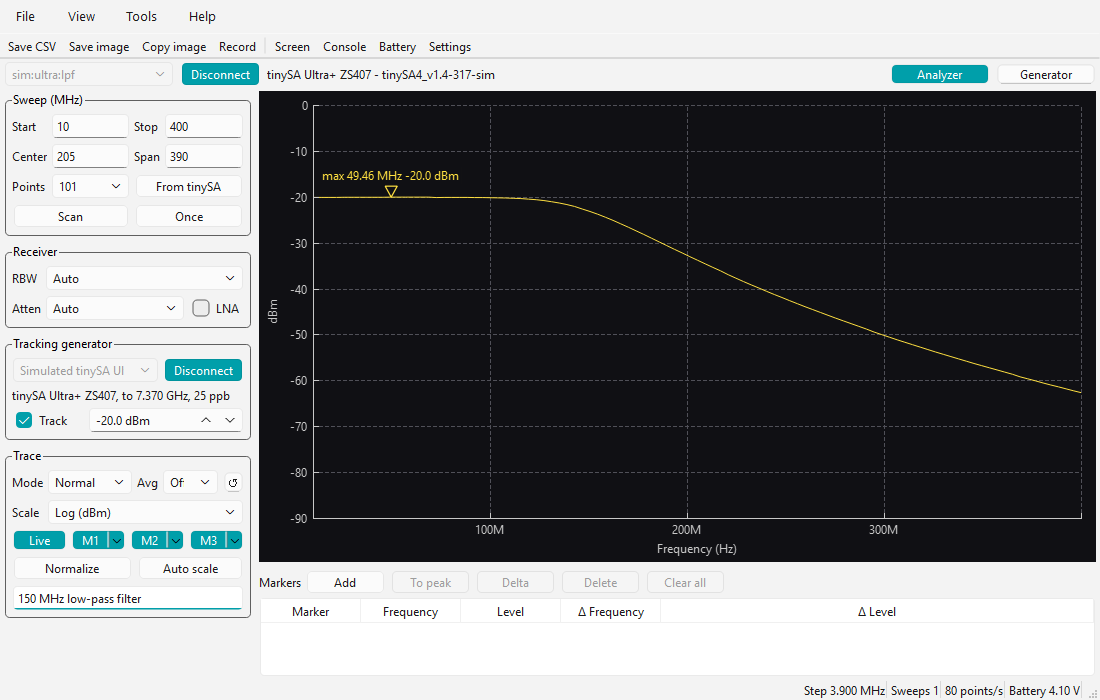
A second tinySA can be used as a tracking generator. Its output follows the sweep point by point: for every point, the generator is set to the frequency that the analyzer measures. This shows the frequency response of filters, amplifiers, attenuators and cables. Either model can be the analyzer or the generator.
The picture shows a (simulated) 150 MHz low-pass filter, measured with a level of -20 dBm.
Setting up
- Connect both tinySAs to the PC with USB.
- Cable the RF output of the generator tinySA (on the tinySA basic: the LOW connector) to the input of the device under test, and the output of the device to the input of the analyzer tinySA.
- In the main window connect to the analyzer as usual.
- In the Tracking generator group, choose the port of the generator tinySA and click Connect. The group then shows the model, its highest frequency and its frequency error in ppb.
- Tick Track and set the level of the generator in dBm.
- Click Scan or Once.
Measuring relative to a cable
- Put a cable in place of the device under test and sweep once.
- Click Normalize: the trace becomes a flat 0 dB line.
- Put the device back. The graph now shows its gain or loss in dB, with the losses of the cables taken out.
Good to know
- The sweep range is limited to what the generator can do (the LOW output of the tinySA basic goes up to 350 MHz), and the level to the levels the generator can make.
- When the generator tinySA connects, the app measures its frequency error at 3 GHz (or at the highest common frequency when that is lower) and corrects every generator frequency for it. This allows narrow RBWs. RBW Auto means 30 kHz while tracking.
- A sweep of 101 points from 10 MHz to 3 GHz takes about 2 seconds with two tinySA Ultras.
- The generator's screen stays off while it is connected (tinySA Ultra firmware v1.4-314 or newer). With firmware v1.4-317 or newer the screens show "Tracking generator" and "Spectrum analyzer". Touching the generator tinySA gives its screen back and stops the scan.
- Tools > Settings > Device sets the time the generator gets to settle at every point. Auto is 10 ms, 32 ms where the Ultra's output changes path (823 MHz and 1130 MHz), and 150 ms when the generator's screen is on.
- With an RBW of 1 to 3 kHz, some points above about 1.1 GHz can read about 10 dB low.
Screen, console, battery and settings
These windows open from the Tools menu or the toolbar.
Screen
- Capture reads the tinySA's screen once.
- Live remote control shows every change of the tinySA's screen. Click or drag on the picture to touch the tinySA's screen. The app stops its own sweeping while remote control is on, and starts it again afterwards. tinySA Ultra firmware that supports it sends the screen compressed, about 8 times less data.
- Fit to window scales the picture to the window.
- Invert colours gives a light background for printing. The picture is also saved and copied with inverted colours.
- Save image and Copy save the picture or copy it to the clipboard.
Console
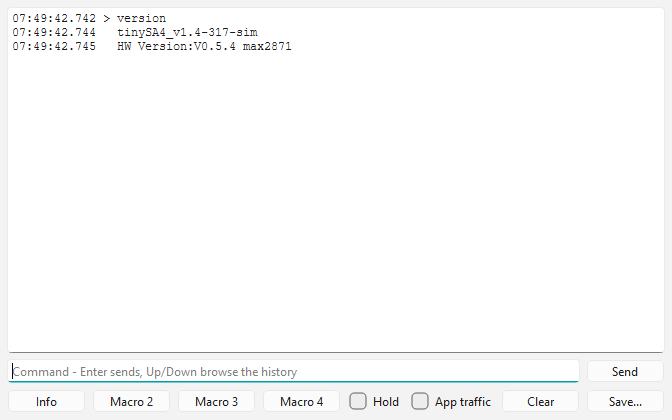
- Type a tinySA command and press Enter. Up/Down browse the commands you typed before. The commands are described on the USB interface page and, for the tinySA Ultra, on the console commands page.
- App traffic also shows the commands that the app sends itself.
- Hold stops the scrolling. Clear and Save clear or save the text.
- Four macro buttons each send a list of commands. Right click a macro button to give it a name and its commands, one command per line. Lines that start with # or ; are comments.
Battery
A plot of the battery voltage over time, read every 6 seconds while the tinySA is connected. Clear starts again, Save image saves the plot.
Settings
- Device: the information of the tinySA (its info reply), the battery voltage offset (Set sends it, Save config keeps it), "Turn the tinySA screen off while scanning", the settle time of the tracking generator, Set clock to PC time, Save config (stores the tinySA's configuration permanently) and Clear config (resets the tinySA's configuration to the factory defaults).
- Appearance: the colours of the app (system, light or dark), the colours of the graph (click a colour to change it), the trace width and the text size. Dark graph and Light graph set all graph colours at once.
- Files: the folder for saved and recorded files, the CSV field separator, the decimal comma and the MHz CSV format.
Updating the firmware
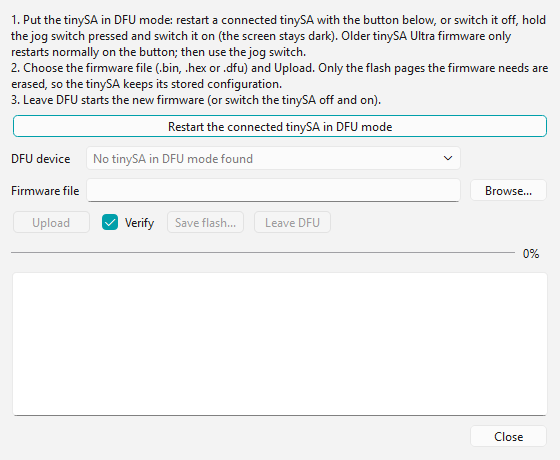
- Download the newest firmware: for the tinySA basic a tinySA_...bin file from http://dfu.tinydevices.org/tinySA/DFU/, for the tinySA Ultra and Ultra+ a tinySA4_...bin file from http://dfu.tinydevices.org/tinySA4/DFU/.
- Connect the tinySA in the app and open Tools > Firmware update.
- Click Restart the connected tinySA in DFU mode. You can also do it by hand: on the tinySA Ultra switch it off, hold the jog switch pressed and switch it on (the screen stays dark); on the tinySA basic select CONFIG > DFU. Older tinySA Ultra firmware restarts normally when you click the button: then use the jog switch.
- The tinySA appears under DFU device. Choose the firmware file (.bin, .hex or .dfu) with Browse and click Upload. With Verify ticked the app reads the firmware back and compares it.
- Click Leave DFU to start the new firmware, or switch the tinySA off and on.
The app only erases the flash pages that the firmware needs, so the tinySA keeps its stored configuration and calibration. Save flash reads the whole flash into a .bin file, as a backup before an update.
In DFU mode Windows needs a driver for the "STM32 BOOTLOADER" device. The app works with WinUSB, libusb-win32, libusbK and ST's DfuSe driver, so a driver that STM32CubeProgrammer or Zadig installed can be used. If no DFU device appears, check in the Windows Device Manager that the device has a driver (no yellow exclamation mark), and if not, install the WinUSB driver with Zadig. See also Updating the firmware.
Command line options
- tinySA-App.exe --port COM5 connects to that port when the app starts.
- --sim adds simulated tinySA units to the port list, to try the app without a tinySA.
- --ini file uses another settings file, for example one per tinySA.
- --version shows the version.